Sale and Reports
Track performance and make data-driven decisions with the Reports section in Bridge. Gain a clear picture of what's selling, when, and where—with tools to break down both revenue and unit counts across your entire operation.
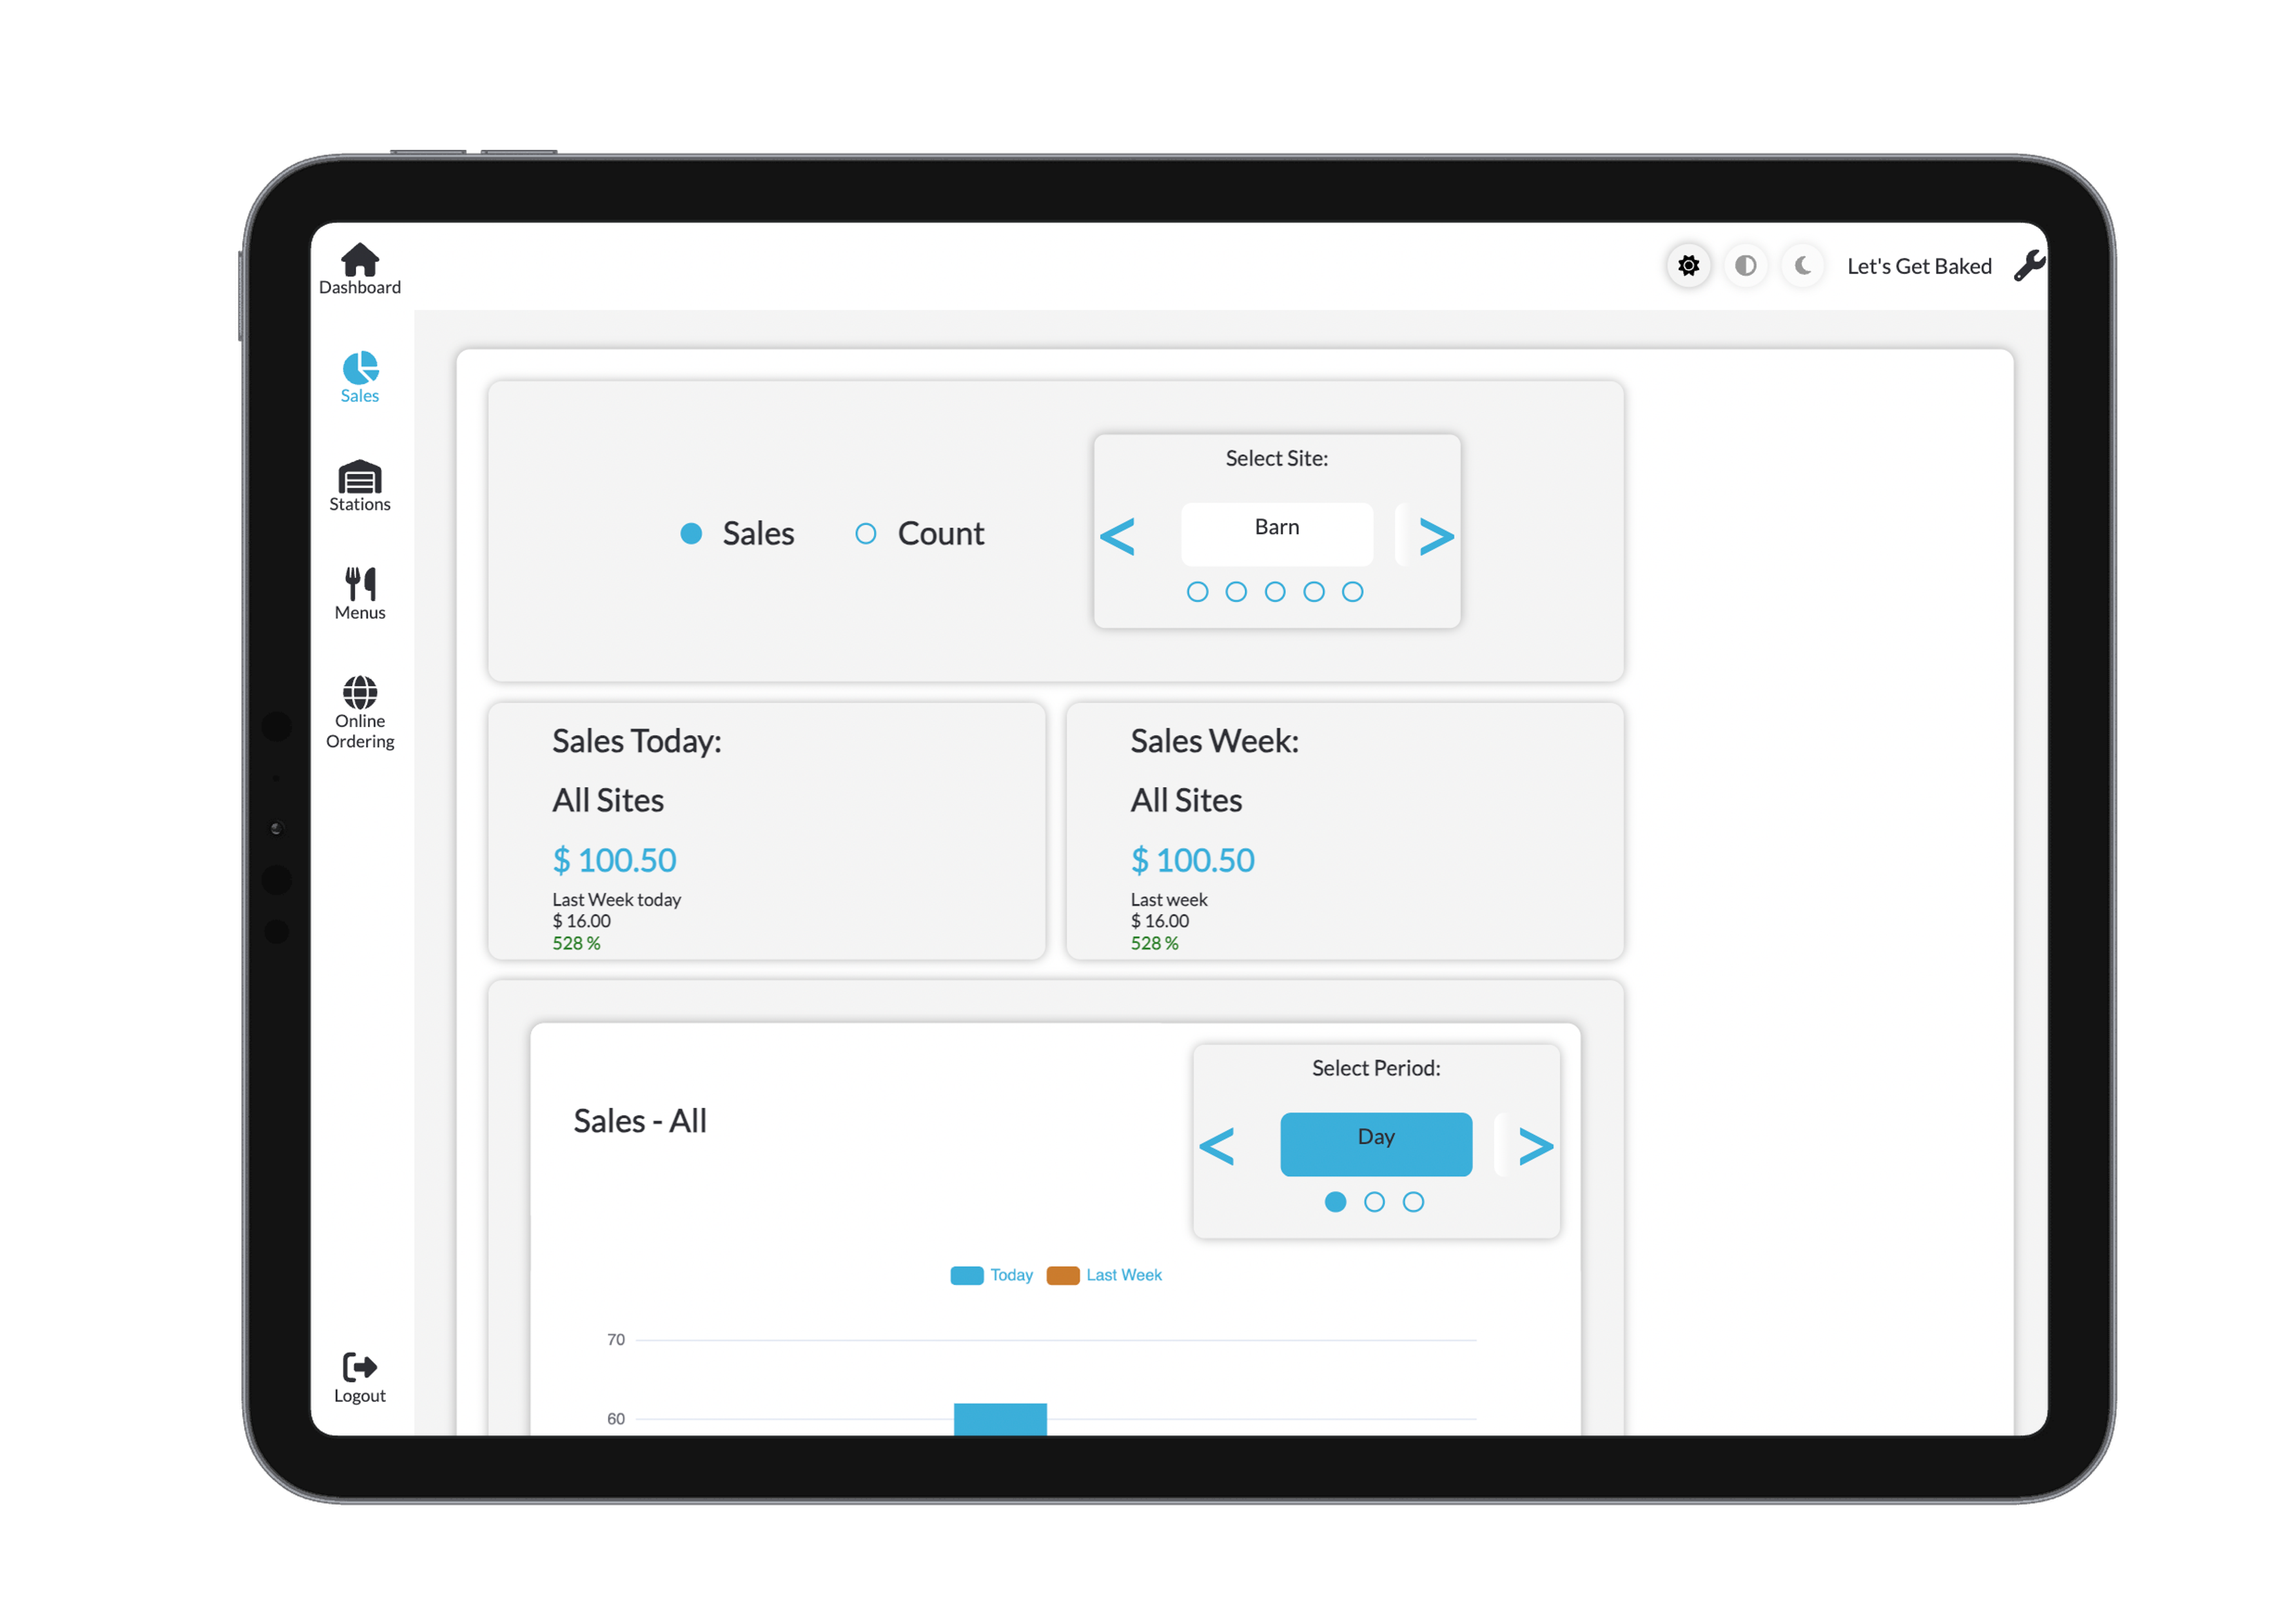
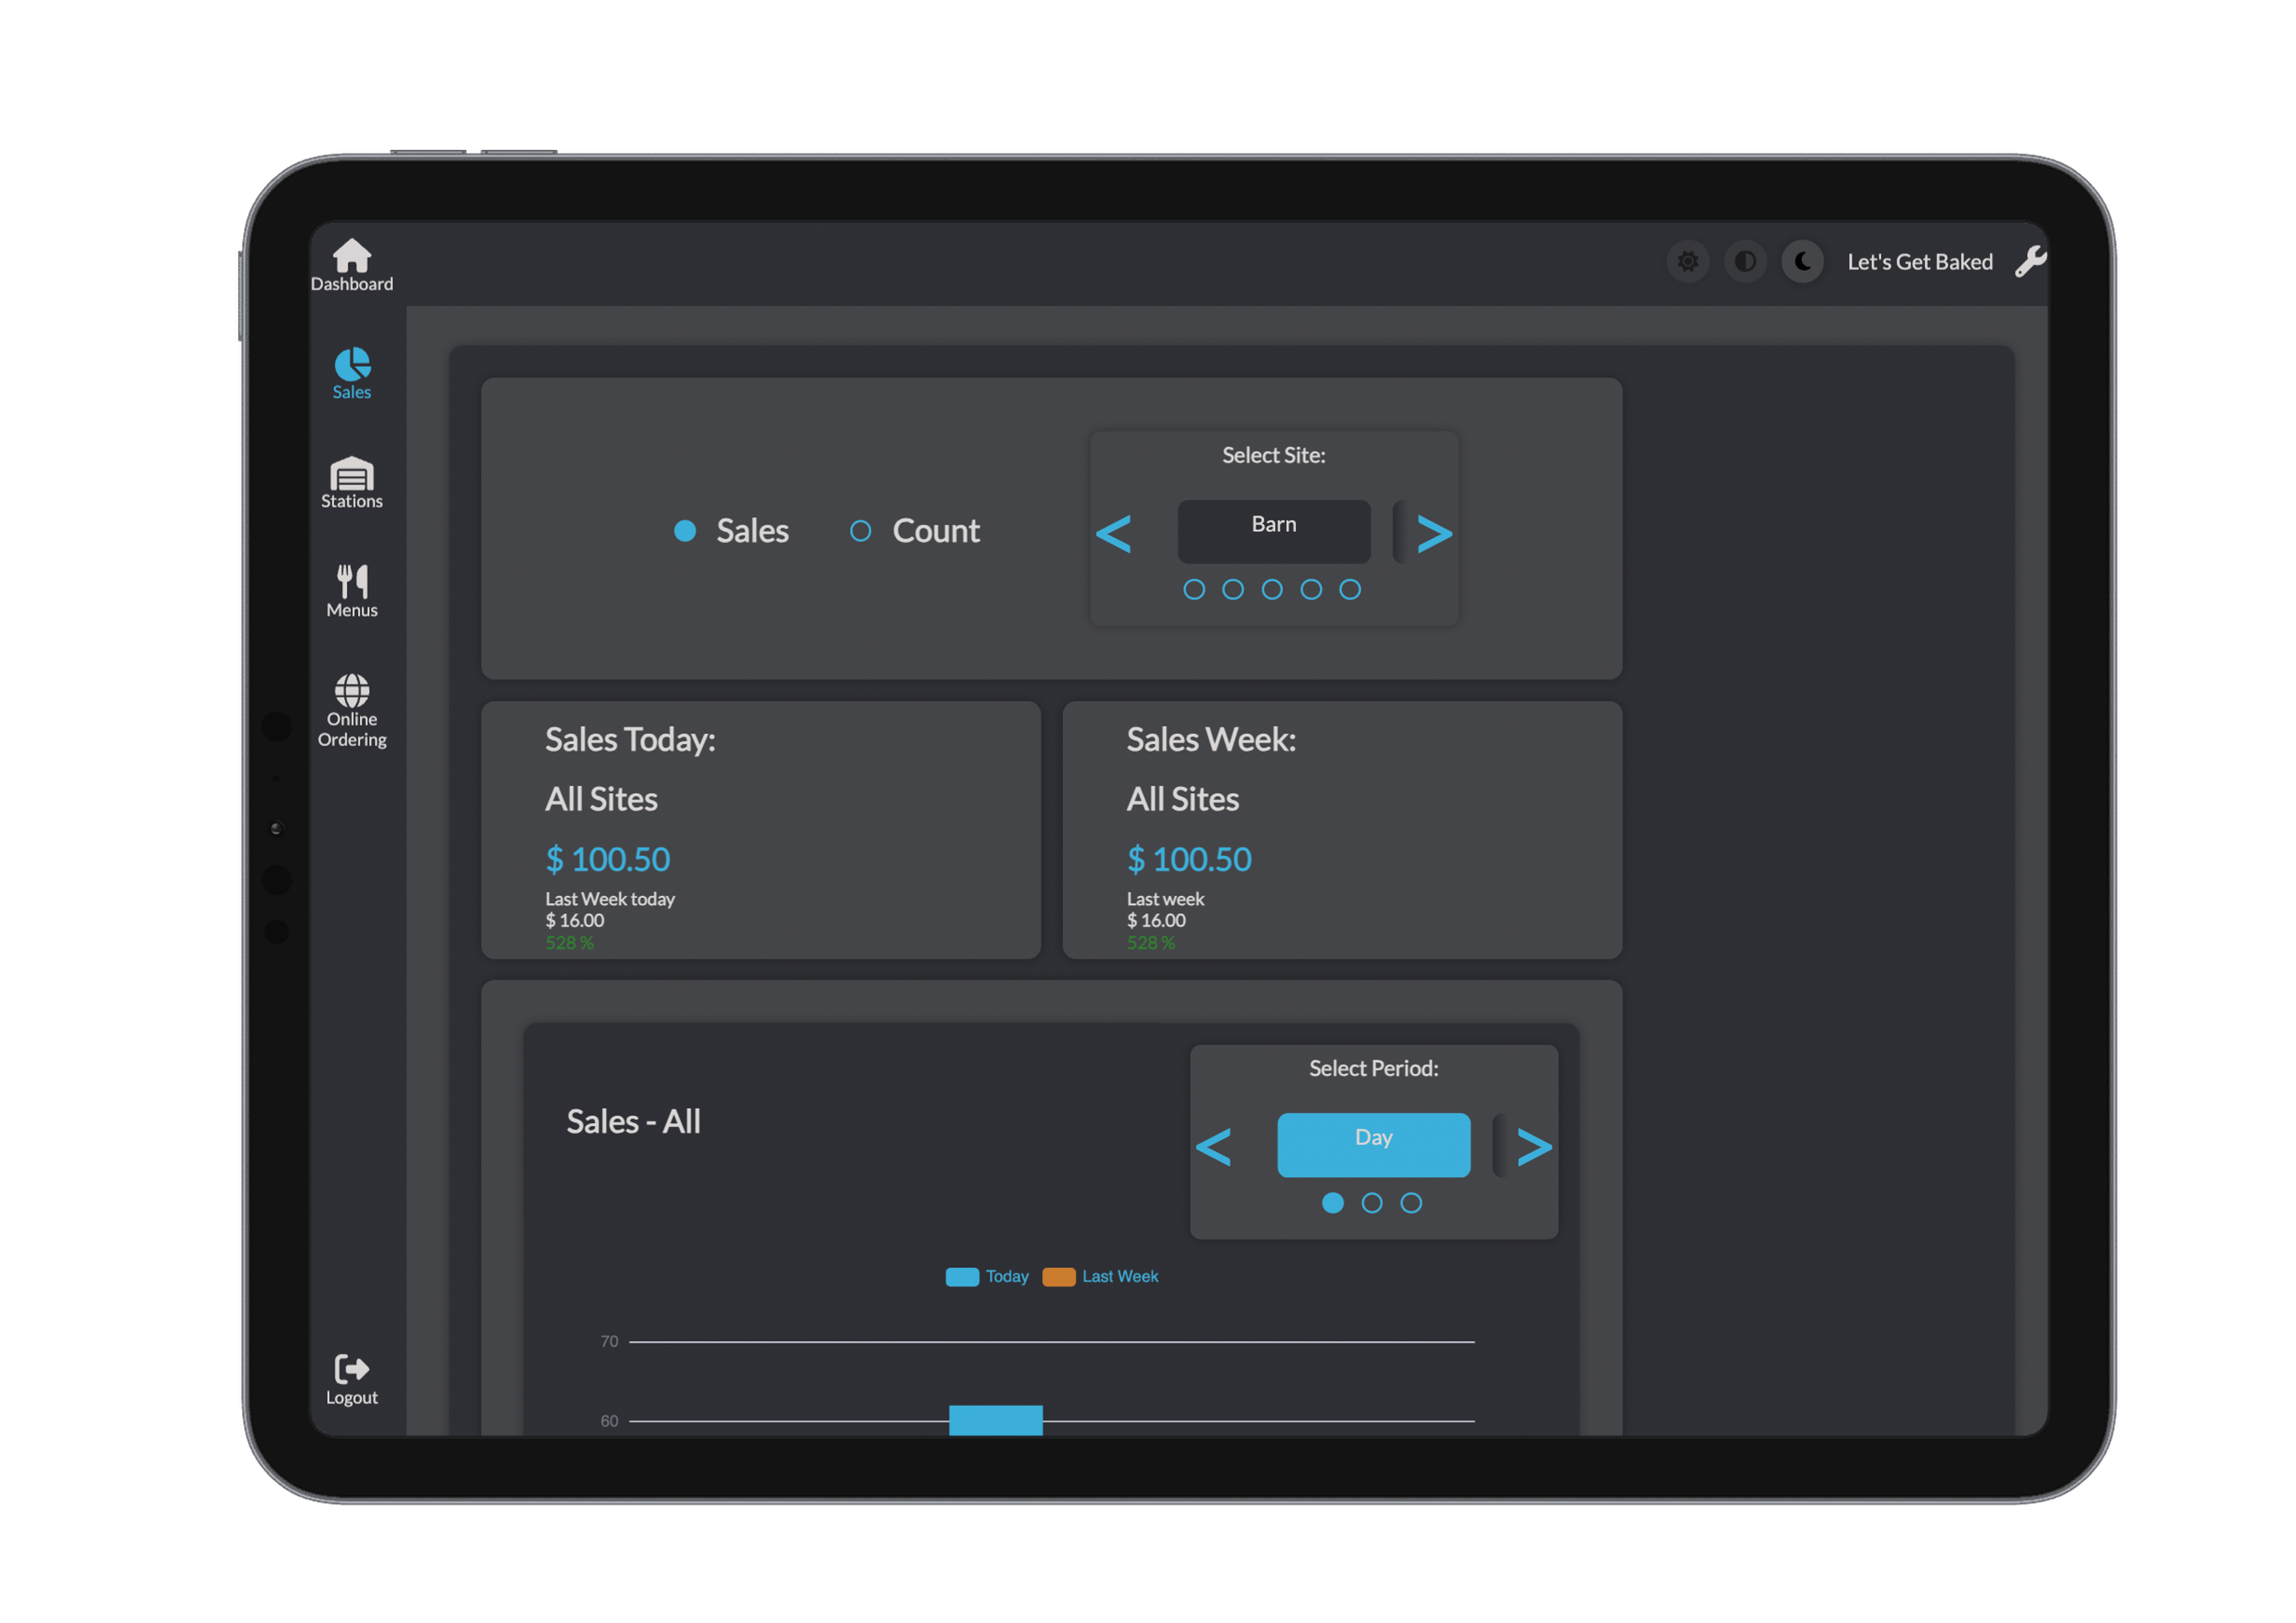
Report Options
Bridge gives you flexible ways to analyze your sales:
- View sales by dollar amount or units sold
- Filter by a specific site or all sites
- Choose time frames like:
- Today
- This week
- Compare to the same day last week
- Full weekly summaries
Reports are ideal for spotting trends, planning inventory, and managing staff performance.
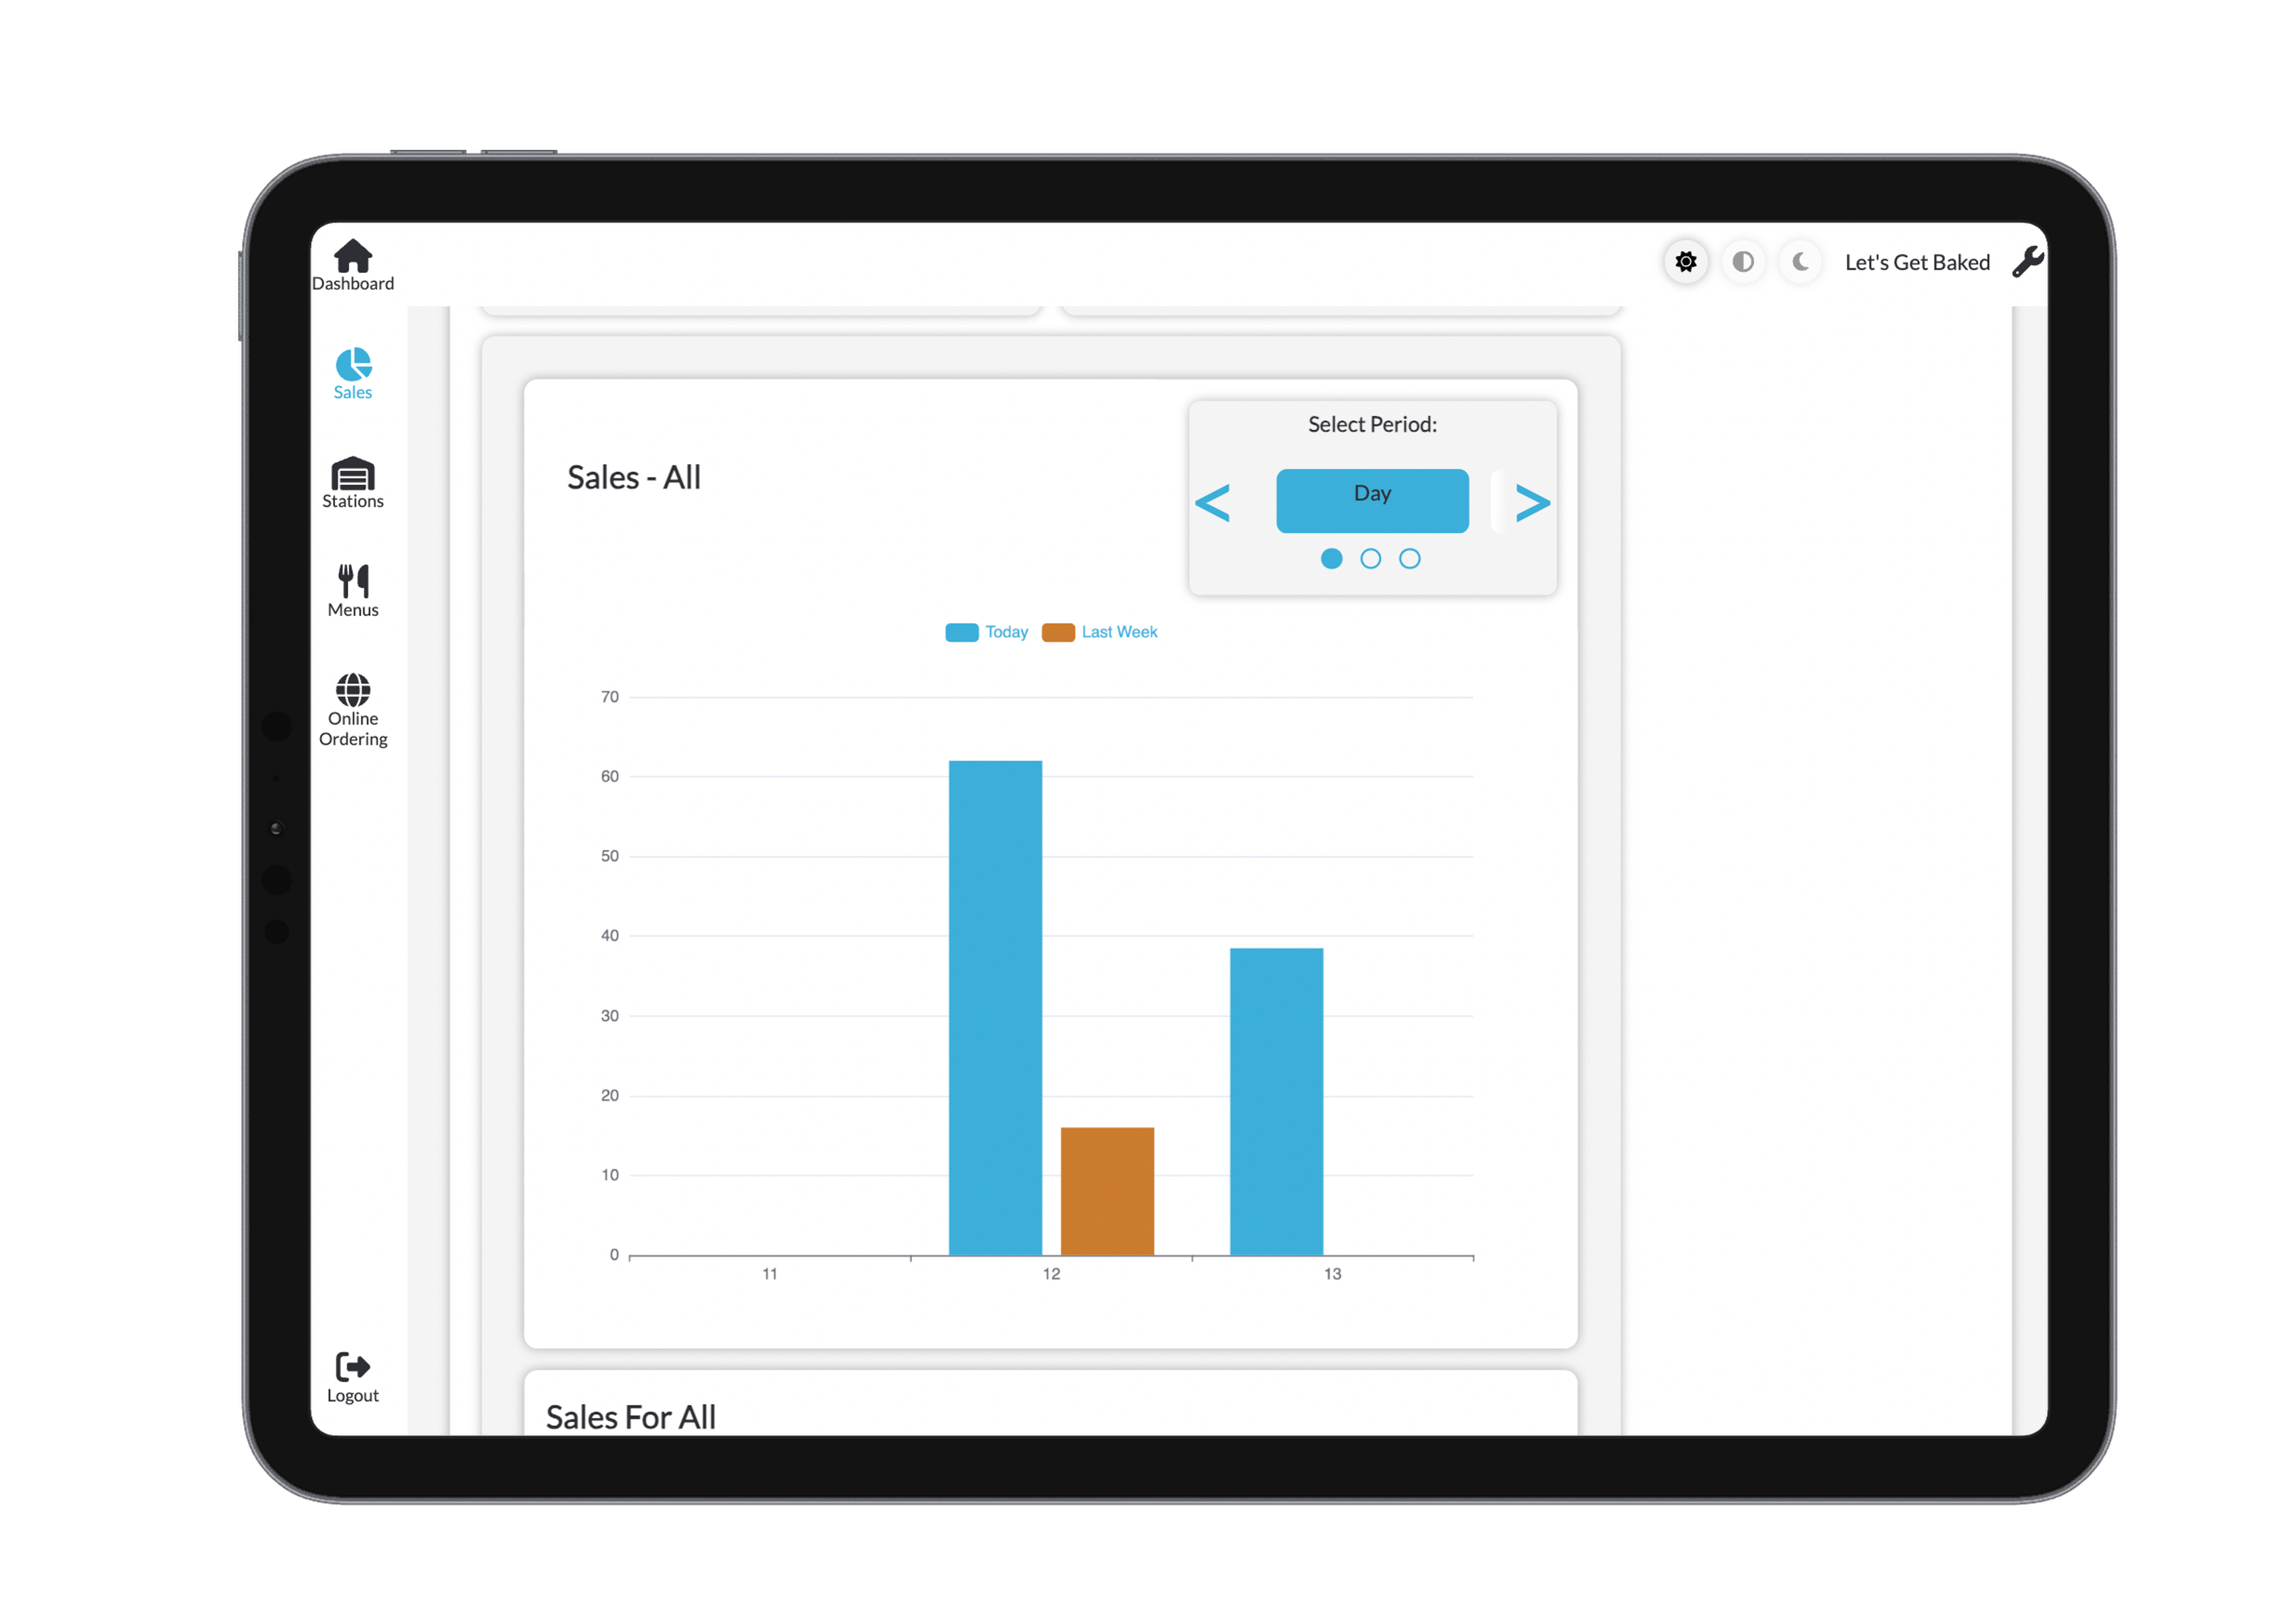
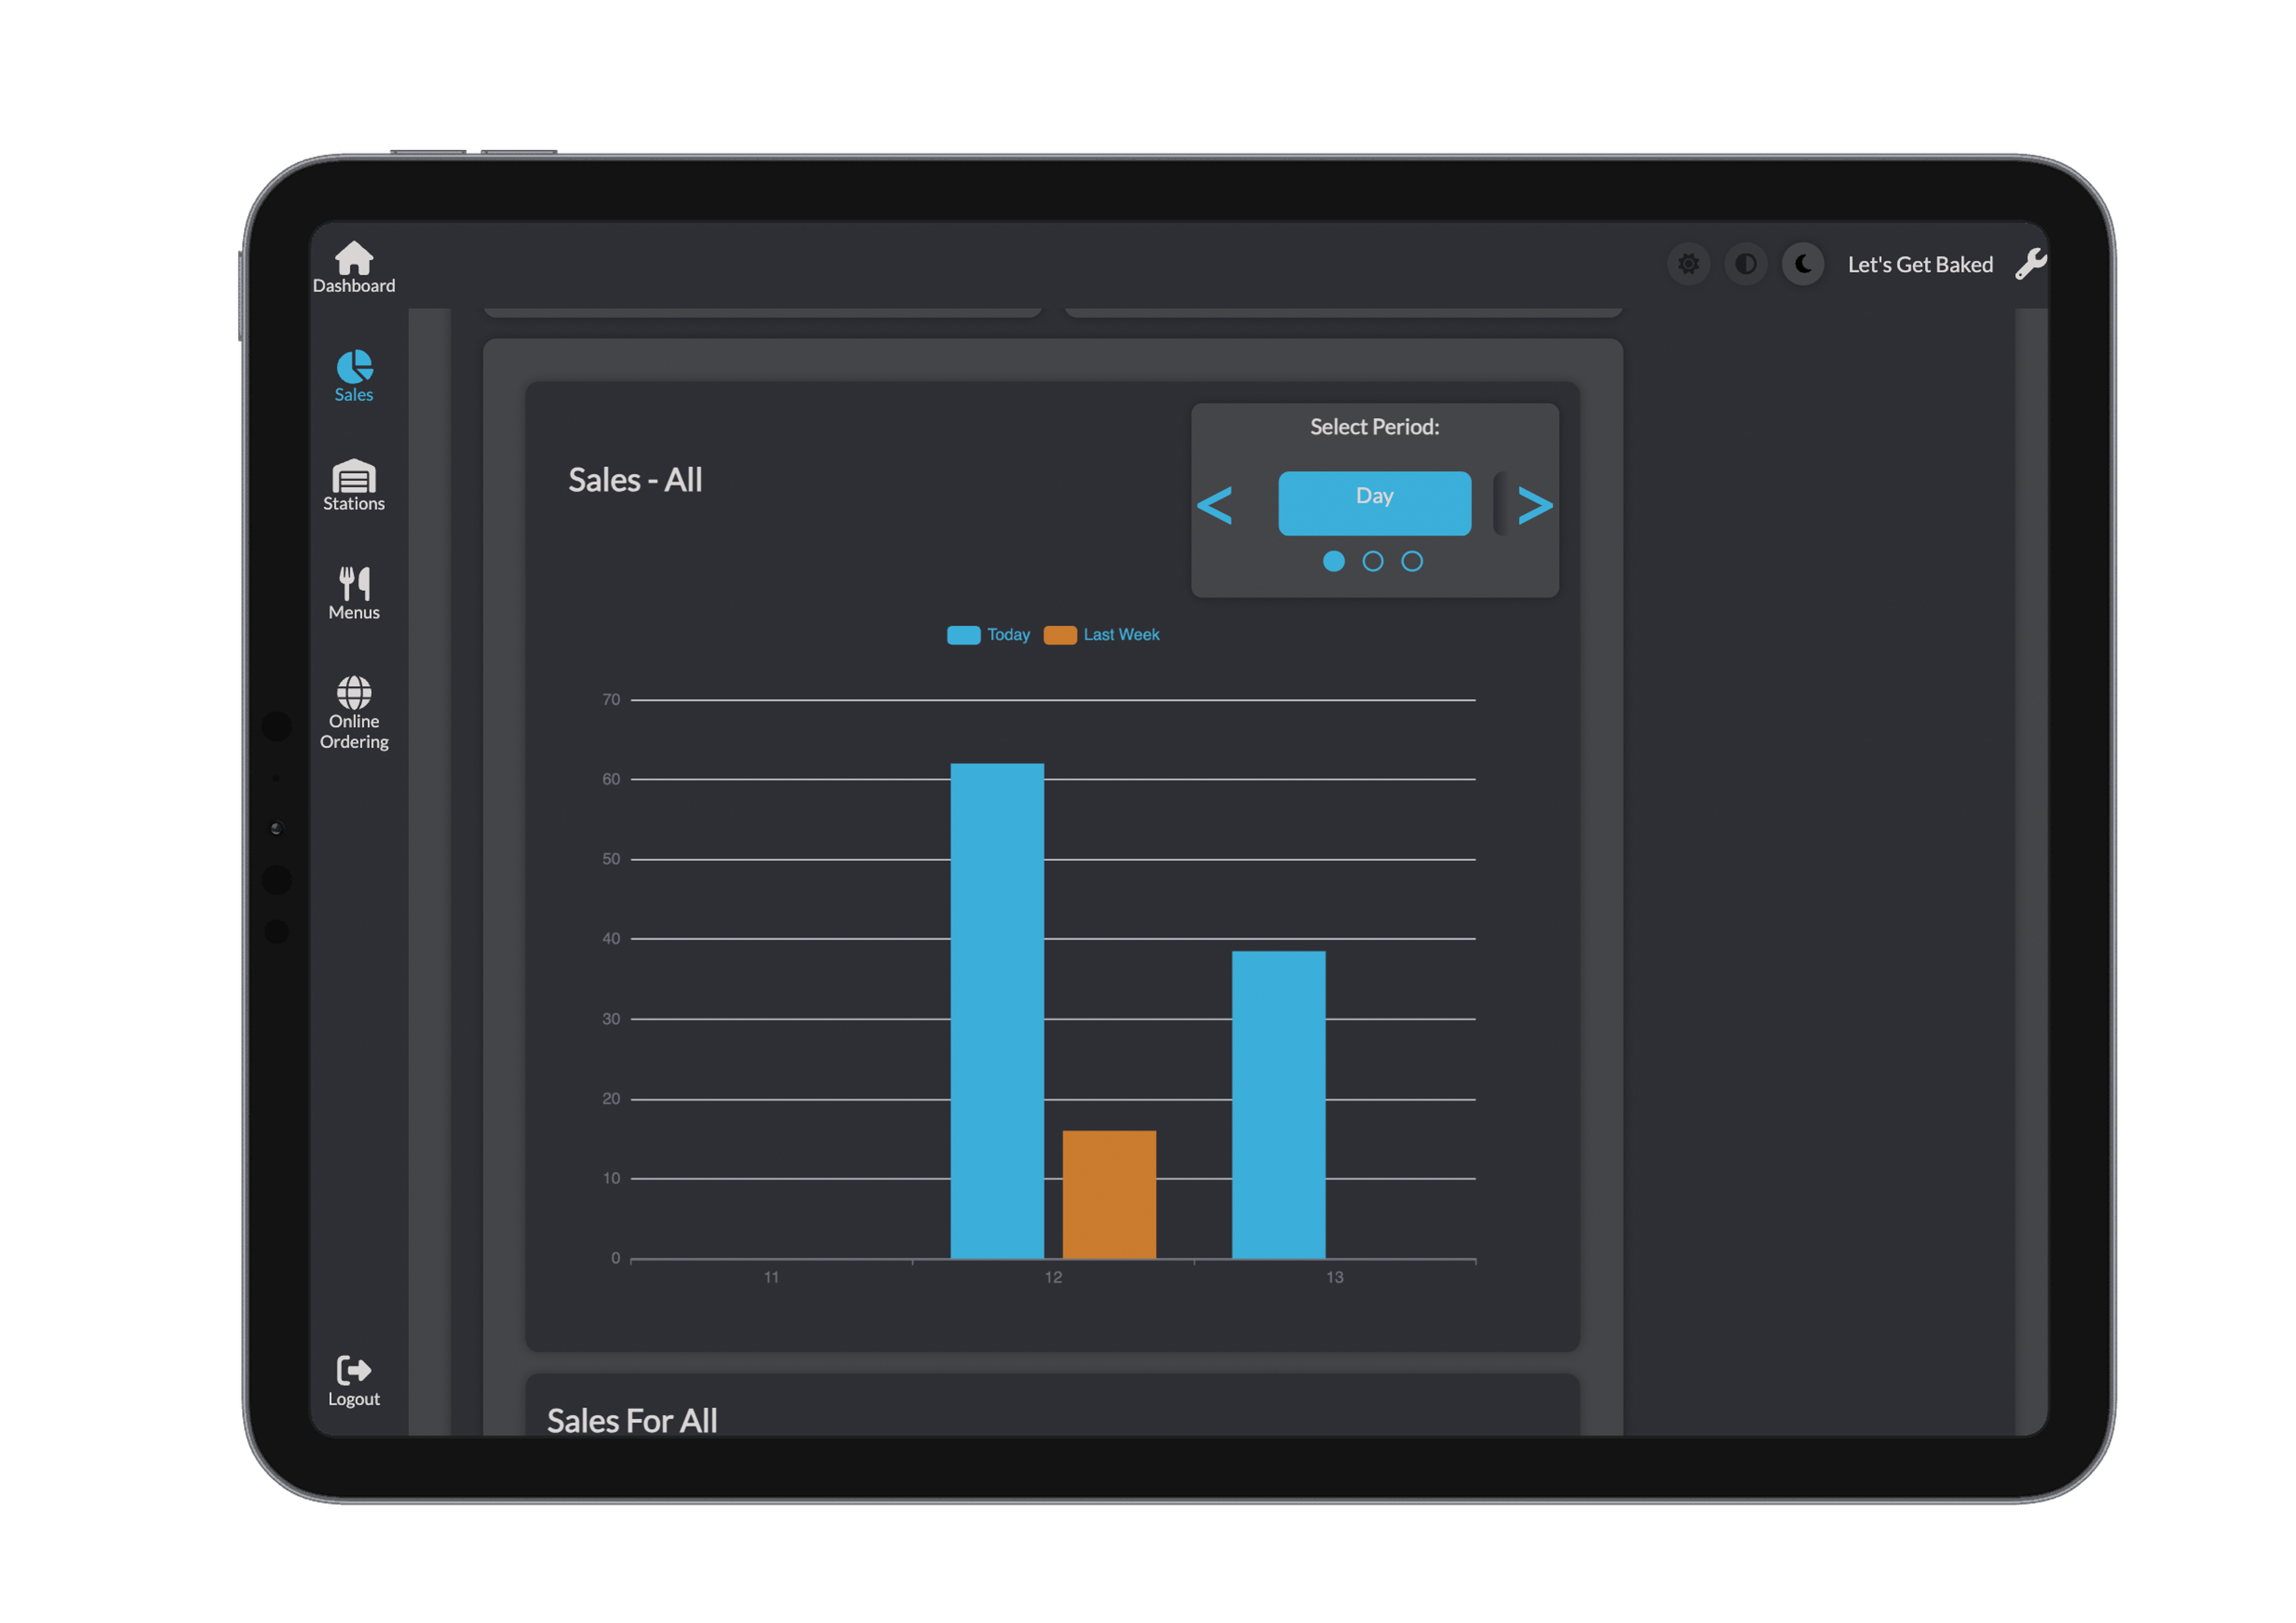
Graphs and Visual Insights
Reports are paired with interactive graphs to make data easier to understand at a glance.
- Bar Graph Comparison
- Compare today’s sales vs. the same day last week
- Toggle between daily, weekly, or monthly views
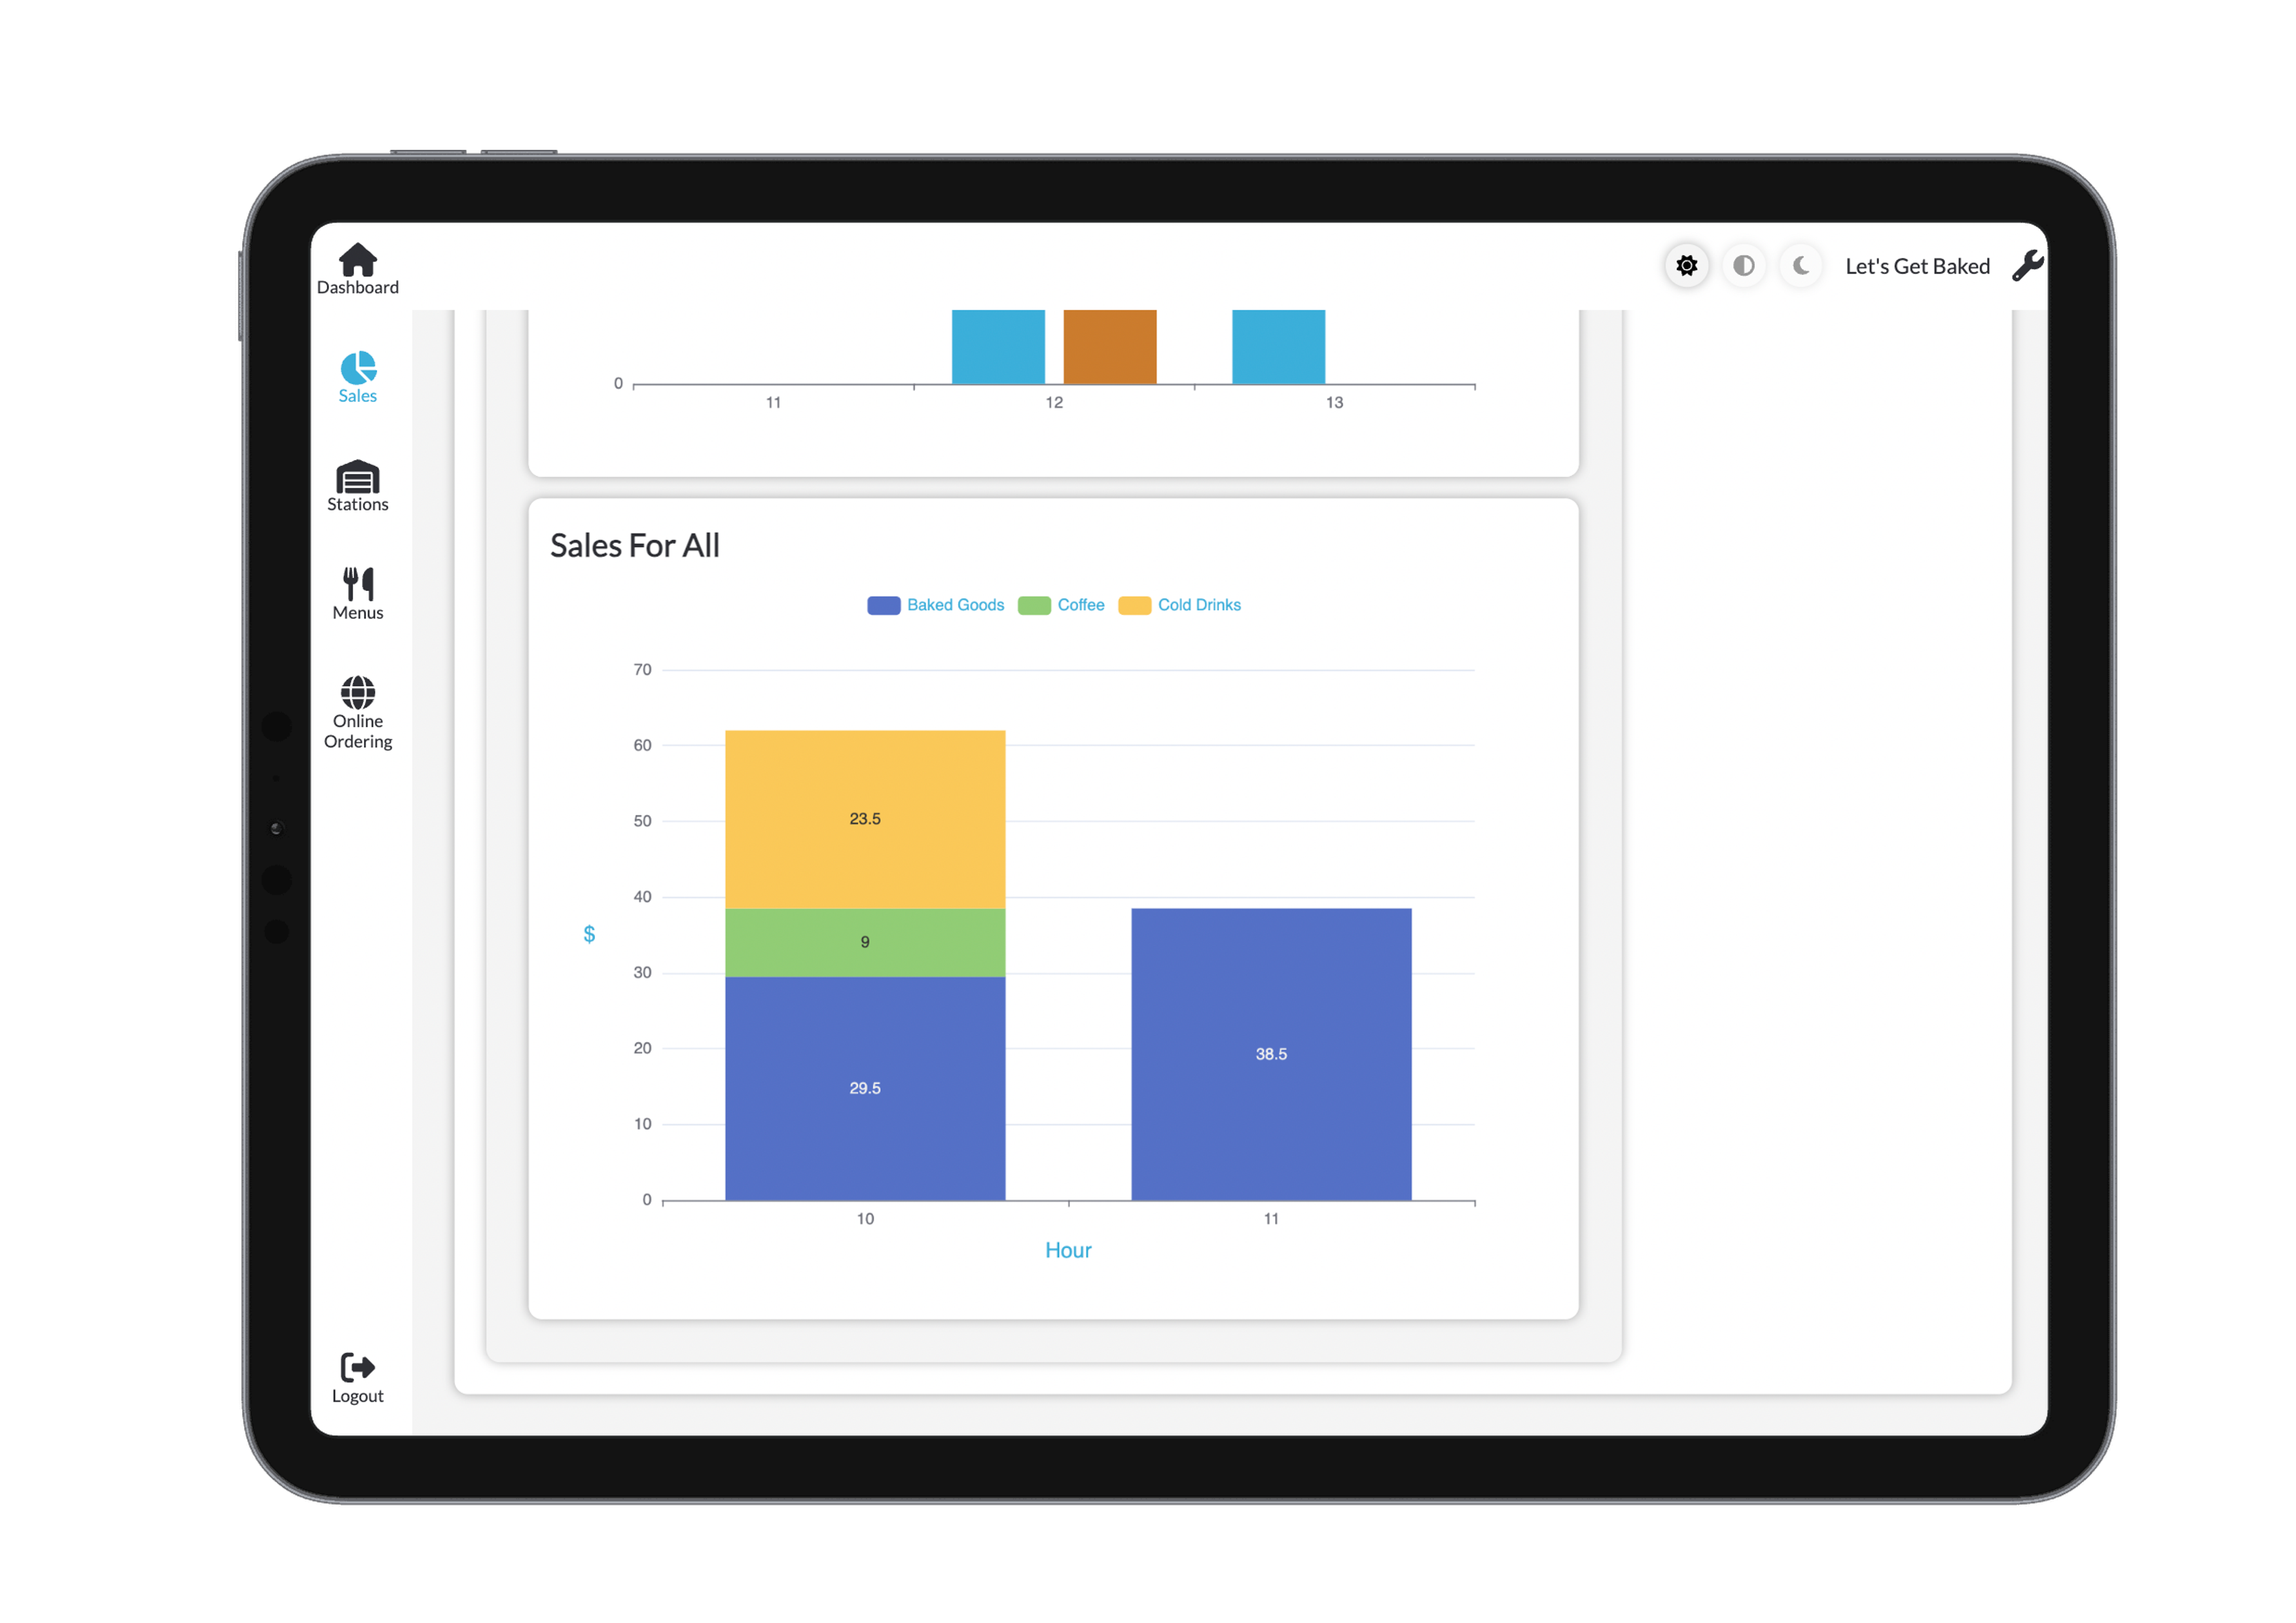
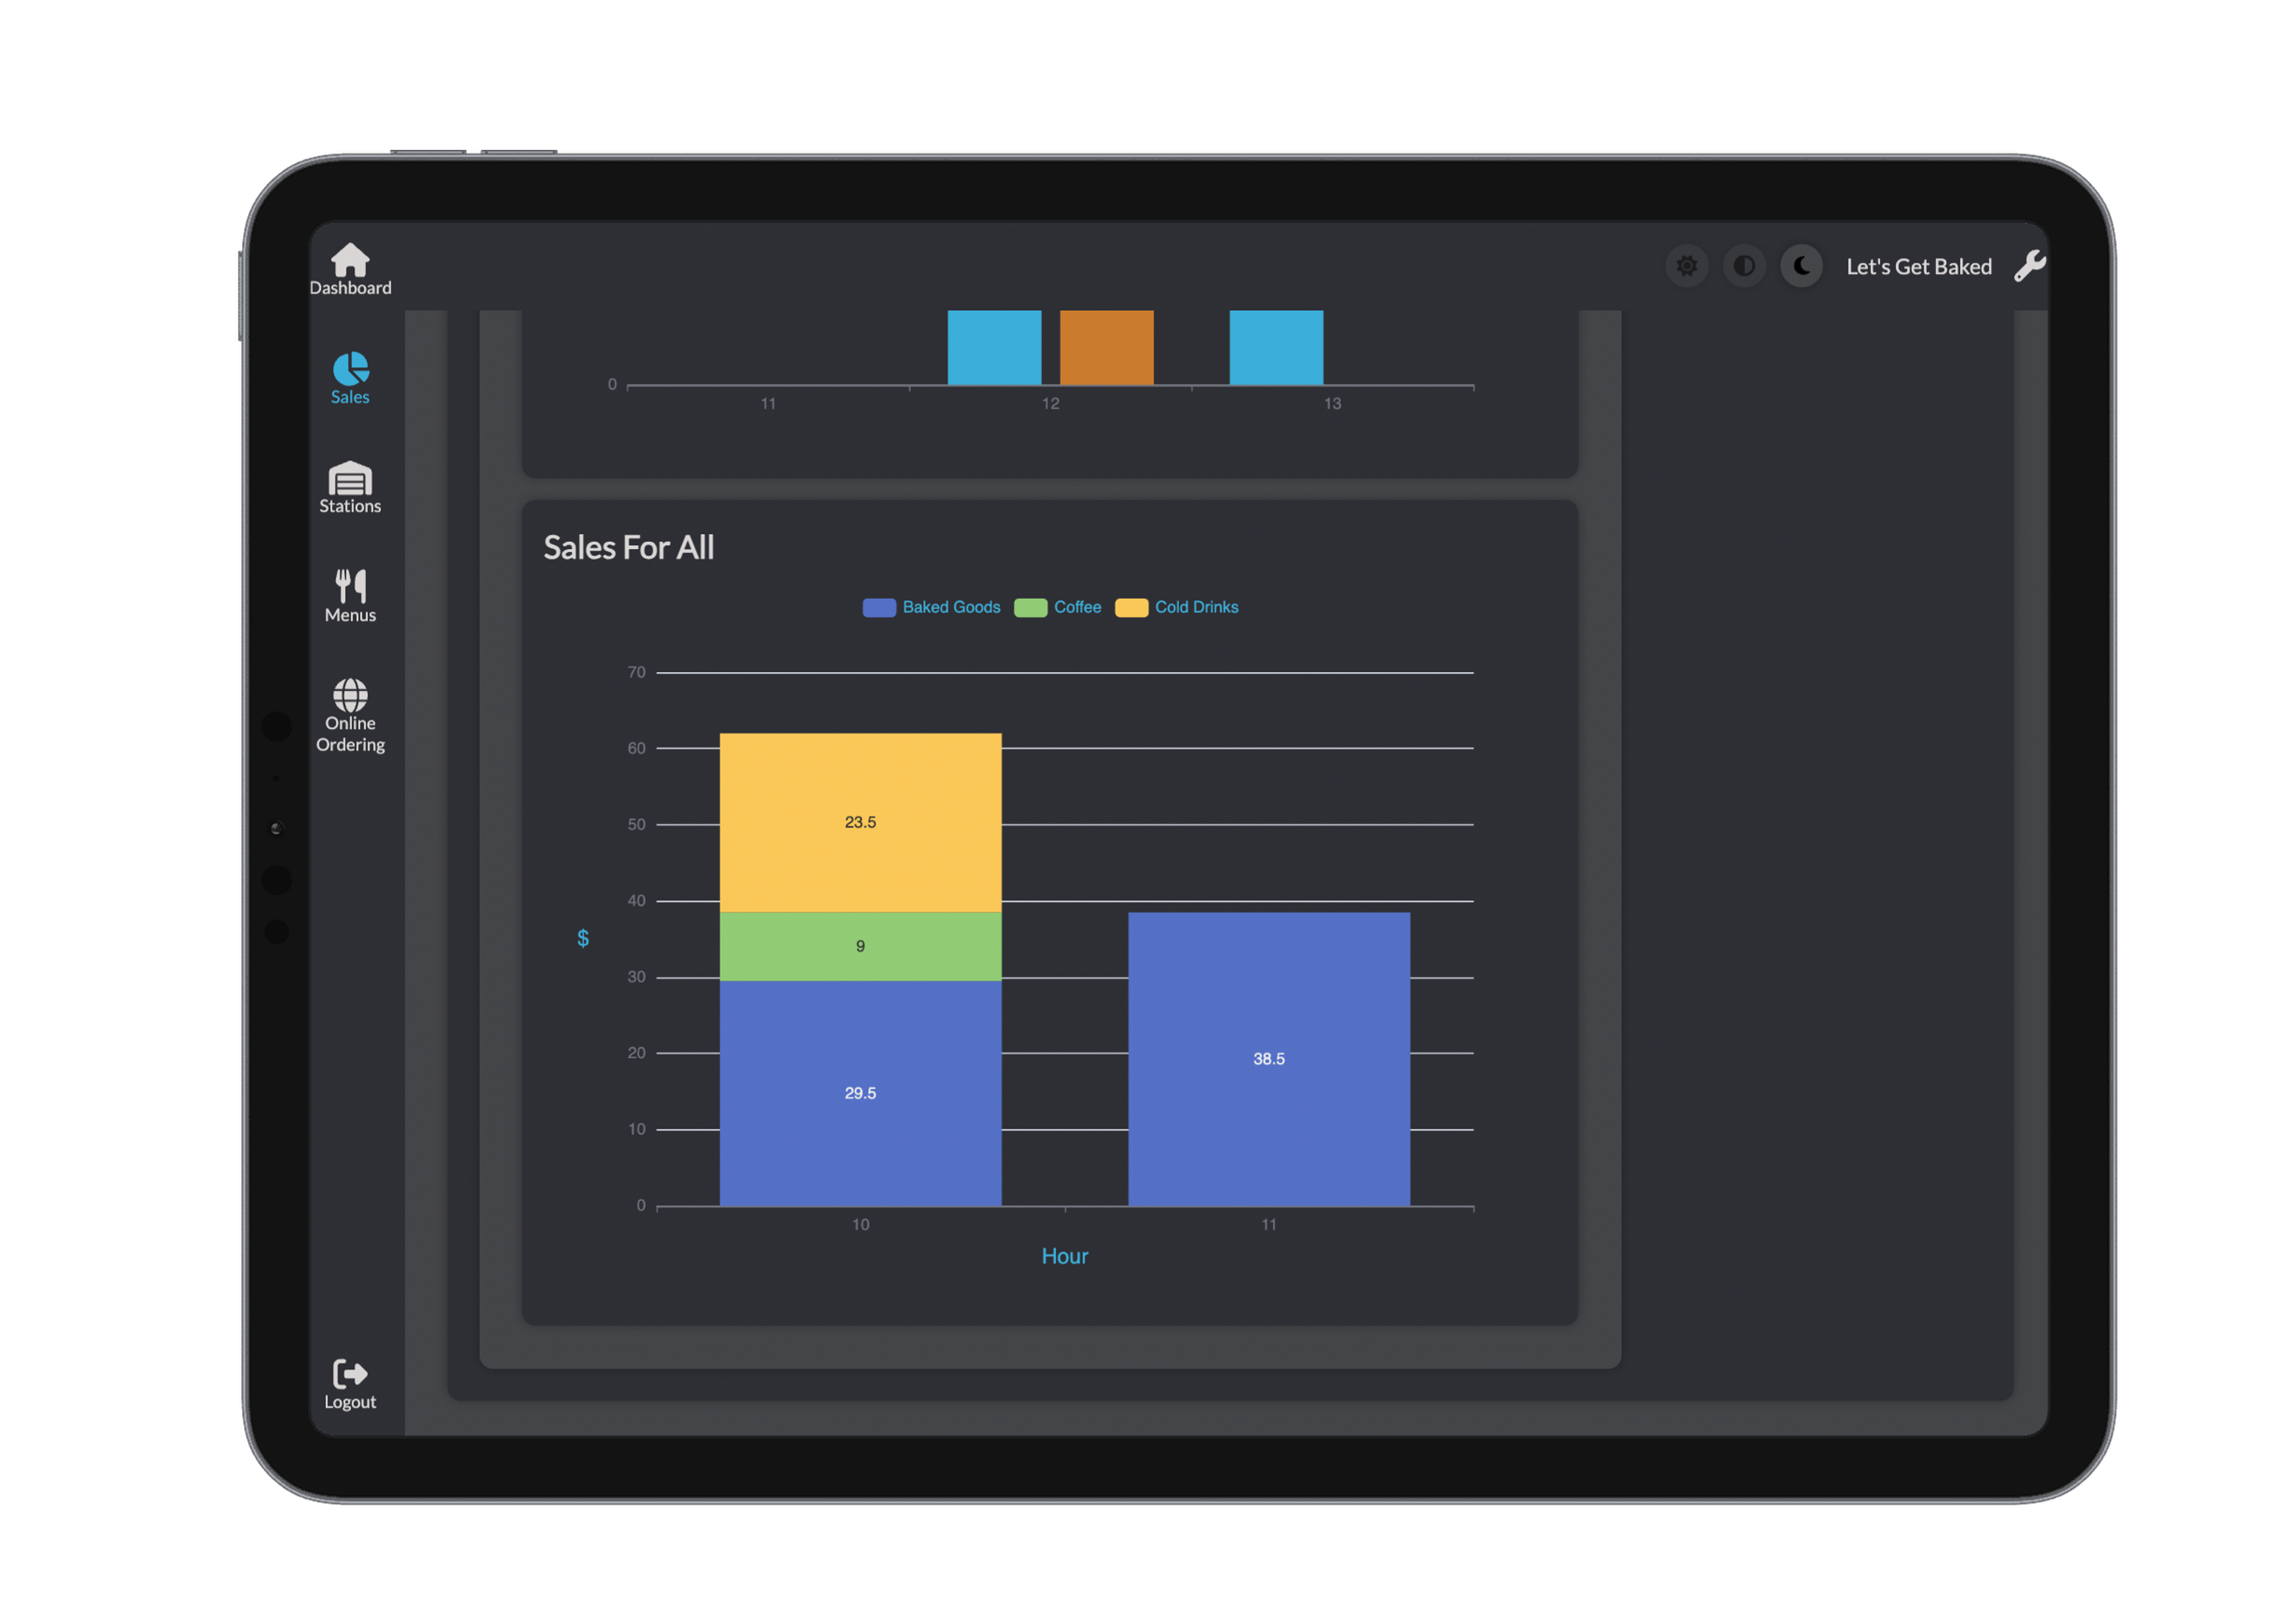
- Stacked Category Graph
- See sales breakdown by product category
- Understand which areas of your business are performing best
Why Use Reports?
- Identify peak sales periods
- Understand top-performing product categories
- Compare performance across multiple locations
- Track growth over time
- Inform staffing, marketing, and ordering decisions
Bridge gives you clear, customisable reports—so you’re always informed and in control.